Infographics
Timelines
Timelines have been an especially useful tool for me to create for our readers/viewers to have a better understanding on stories we have been following for extended periods of time. This example, created through Knightlab, provides context on a case where two people were killed in Dane County. It follows developments by law enforcement, the trial and events following sentencing.
Before & After
This slide bar, also created using Knightlab, has been an interactive graphic I have made to demonstrate before and after scenes to viewers/readers. In this example, it was used to show a milling plant in Wisconsin before and after an explosion.
Gifs
Gifs are a great way to show small clips of video that would be intriguing to readers. In this case, I created a quick gif to go with a reporter's web story about F-35 fighter jets arriving at Madison's Truax Field for the first time, an event that has been highly anticipated in the community.
Charts
Bar charts, pie chart and line graphs are all features that are easy to create, but that add elements to web stories that make them easier to digest. I would write COVID-19 update stories daily for WMTV during the height of the pandemic and would sometimes make graphs or charts to illustrate new data points. This bar chart was made using Flouirsh.

Illustration
As an Infographics Team Member at the Columbia Missourian, I created graphics for daily reporters as well as for special sections. This graphic was worked on with a team of graphics members to show our readers how to make their own face mask during the start of the COVID-19 pandemic. I created "Option #2: Bandana Mask" using Adobe Illustrator and information from the Centers for Disease Control and Prevention information page. I even used this method myself while out reporting.
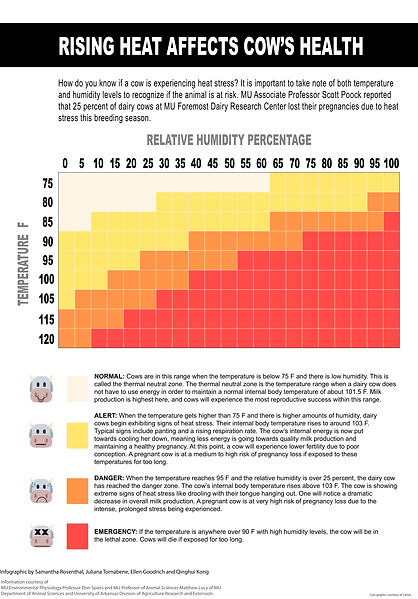
Magazine-style
This infographic was part of a long-form multimedia story about how climate change has been affecting cow pregnancies. My team wanted to illustrate that the body temperature and humidity levels can actually lead to the loss of a cow pregnancy. I used Adobe Indesign and Canva for this graphic.